LLMs as Research Grunts: Surprisingly Useful, Even When They Don’t Get It ‘Right’
Published
June 3, 2025
So, I teach a course on data visualization here at Lund University. We get our students to wrestle with data, trying to make sense of regional development in Europe using maps. The tool we start them on is Stata. Now, Stata has its place, especially in academic circles. It’s the software many of them have seen before they land in my course. But let’s be real: if you’re aiming for a job outside the ivory tower, particularly in today’s dynamic tech scene, Stata isn’t exactly the belle of the ball.
My job, as I see it, is to give them the concepts with Stata but also nudge them towards the reality of the modern data landscape. And in the age of Large Language Models (LLMs), that landscape has a new contour. If you want to supercharge your learning and problem-solving, you want a language with a Mt. Everest-sized pile of high-quality training data; Python or R. These languages have vibrant online communities, endless tutorials, and, crucially, they’re what LLMs have been munching on. Ask a good LLM to whip up a Python tutorial for a specific task, or debug your R script, and you’ll often get something impressively coherent. Try that with a more niche language, where the main online resource is something like Statalist (bless Nick Cox), and the LLM might just stare back blankly, or worse, confidently hallucinate; a reminder that these tools are powerful, but not infallible.
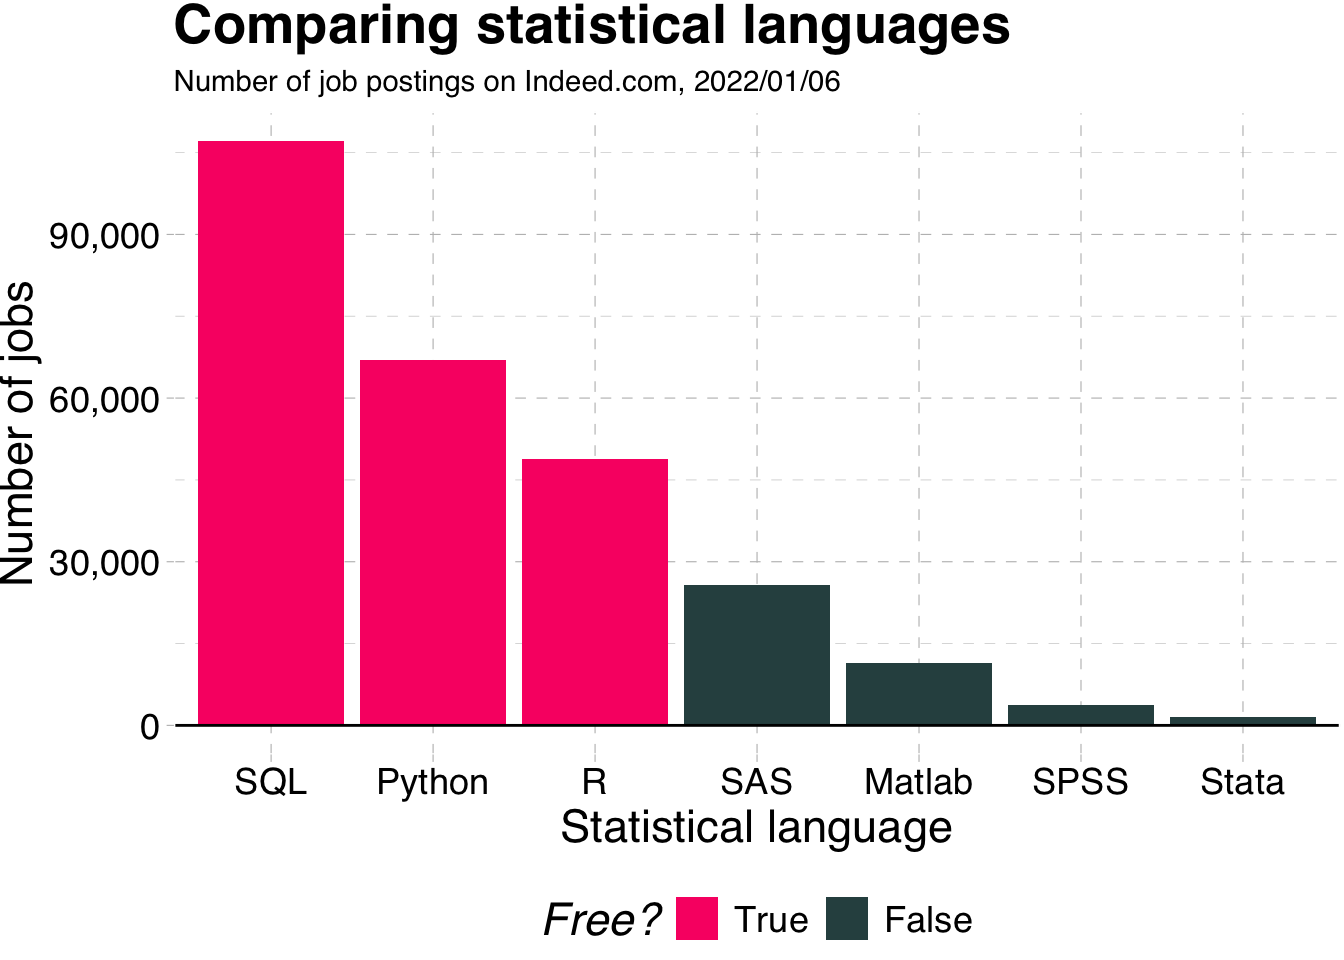
This isn’t just a theoretical concern. Grant McDermott in Oregon put together a striking graphic back in 2022 showing the demand for various coding languages in US graduate jobs. Spoiler: SQL, Python, and R were crushing it. Stata? Not so much.
Naturally, I wanted to update this for my students, but with a Swedish focus. Sweden has a fantastic resource, Arbetsförmedlingen (the public employment agency), which not only collects job ads but also has an API and even a model to extract skills from those ads. Super neat. The catch? Wrangling that API, ingesting the data, filtering for programming languages, and then plotting it all out – that’s not a five-minute job. That’s a “clear your afternoon and brew a large pot of coffee” kind of job.
This seemed like a perfect test case for the latest AI trendy tool. The promise of Gemini 2.5’s Deep Research tool is that it can sift through a vast amount of information and synthesize it into a detailed report. Even better, Google recently bolted on an infographic generator. So, I gave it a whirl. My prompt was basically: “Research the Swedish graduate job market for Python, R, and Stata, and try to recreate Grant McDermott’s figure for Sweden.”
Now, let’s be clear. Getting an AI to perfectly execute a multi-step research project that involves API interaction, data cleaning, specific filtering logic, and precise chart replication is still a bit of a moonshot. And sure enough, Gemini didn’t quite manage to replicate the Arbetsförmedlingen data-crunching exercise I had vaguely envisioned. If you want that level of precision, you still need to roll up your sleeves and write the script yourself (or hire a human research assistant).
But here’s the kicker, and the whole point of this post: what Gemini did produce was, frankly, astonishingly useful. It didn’t give me the exact bar chart I initially asked for, derived directly from live API data. But it gave me something arguably just as valuable for my students, especially considering the minimal input I provided.
It spat out a comprehensive infographic, packed with contextual information about the demand for these languages in Sweden.
This infographic (which you can see a snapshot of above) didn’t just give vague numbers. It broke down:
Common job titles associated with each language.
Key sectors where these skills are in demand.
Skills often paired with Python, R, or Stata (think SQL, Azure, Machine Learning, econometrics).
Succinct use-case descriptions for each language.
Broader strategic recommendations for graduates navigating the Swedish tech job market.
It even highlighted that Python is in broad demand, R is more for specialized analytical roles, and Stata is, as expected, more niche and academic. It gave a qualitative richness that a simple bar chart, even if I’d managed to create it, wouldn’t have conveyed on its own.
What’s the takeaway here? Gemini 2.5, with its deep research and summarization smarts, isn’t (yet) a perfect, autonomous research assistant that can handle every complex, bespoke data task you throw at it. If your project requires intricate data sourcing from specific APIs and nuanced, multi-step processing, you’re still the lead investigator.
But – and this is a big “but” – as a tool to get you 80% of the way there with 5% of the effort? It’s a revelation. For generating a broad understanding, gathering contextual information, and even producing a surprisingly polished visual output with very little prompting, it’s a massive productivity lever. It’s like having a team of very fast, very eager research grunts who can synthesize public information and make nice slides, even if they can’t yet design the whole experiment or run the final analysis.
For educators like me, trying to give students relevant, up-to-date insights without spending days on data wrangling for every single lecture point, this is a huge win. It’s not about replacing deep, critical thinking or manual data work entirely. It’s about augmenting our ability to explore, synthesize, and communicate information, faster and more effectively, particularly for understanding local contexts like the Swedish job market. And in a world drowning in data, that’s a skill – and a tool – worth its weight in gold.
So, to my students here in Lund: don’t just learn the code, learn how to leverage these new AI assistants. They won’t do your thinking for you, but they can definitely help you think bigger, faster, and smarter about your future careers.